The Leading Source for Wine Industry Data

Wine Analytics Report
A monthly digital publication.
The latest wine industry metrics, market analysis and trends shaping the wine industry.
Ensure your company's success by making informed business decisions based on market conditions and emerging trends.
Industry Databases
Exclusive access to proprietary industry data.
Identify potential sales prospects and new markets.
Create and save searches for highly tailored results.
Buyer’s Guide
Easily locate products and services.
Identify vendors and products across 190 winery categories and 365 subcategories.
Refine search with subcategories and product detail.
Includes over 2000 wine industry vendor profiles outlining their product lineup with contact links.
Directory
Current and comprehensive guide of wine and grape industry professionals in North America.
Identify prospective clients.
Available in print.


WINE INDUSTRY METRICS
| Total U.S. Wine Sales | |||||
| Month | 12 Months | ||||
| April 2024 | $7,856 mil | 3% |
$107,547 mil | 4% |
|
| April 2023 | $7,640 mil | $103,502 mil | |||
| Month | 12 Months | ||||
| April 2024 | $926 mil | -3% |
$12,479 mil | -2% |
|
| April 2023 | $956 mil | $12,735 mil | |||
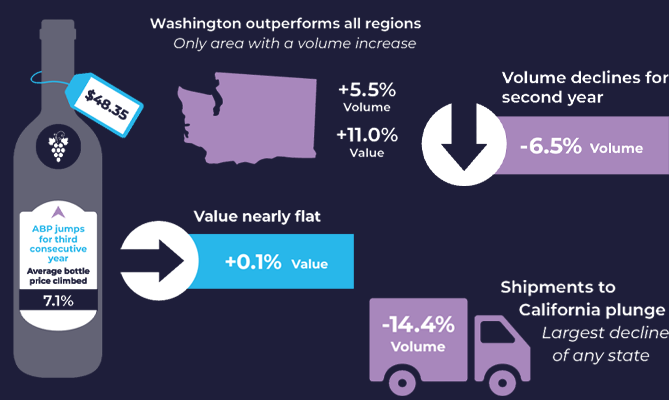
| Direct-to-Consumer Shipments | |||||
| Month | 12 Months | ||||
| April 2024 | $390 mil | 5% |
$4,102 mil | -0% |
|
| April 2023 | $370 mil | $4,112 mil | |||
| Winery Job Index | |||||
| Month | 12 Months | ||||
| April 2024 | 529 | -25% |
480 | -26% |
|
| April 2023 | 707 | 649 | |||
Winejobs.com’s Winery Job Index was 529 in April, down 25% versus a year ago, according to the latest Industry Metrics data in the May issue of the Wine Analytics Report.